Node.JS
如何在Node.js中检测内存泄漏?
跟踪Node.js应用程序中的内存泄漏是一个富有挑战性的项目,下面通过使用两个很棒的node模块memwatch 和 heapdump.来说明如何检测跟踪内存泄漏。
下面是一段内存泄漏的样本代码:
var http = require('http');
var server = http.createServer(function (req, res) {
for (var i=0; i<1000; i++) {
server.on('request', function leakyfunc() {});
}
res.end('Hello World\n');
}).listen(1337, '127.0.0.1');
server.setMaxListeners(0);
console.log('Server running at http://127.0.0.1:1337/. Process PID: ', process.pid);
每次请求增加1000个泄漏listener。
我们在linux下通过反复调用脚本:
while true; do curl http://127.0.0.1:1337/; done
在另外一个shell窗口观察node流程:
top -pid <process pid>
可以看到Node流程内存消耗非常高。
内存泄漏检测
我们通过安装memwatch 能够方便发现内存泄漏,首先安装这个模块:
npm install --save memwatch
在我们的代码中加入:
var memwatch = require('memwatch');
memwatch.setup();
加入发现泄漏的事件:
memwatch.on('leak', function(info) {
console.error('Memory leak detected: ', info);
});
现在可以重启应用,会发现有以下输出:
{
start: Fri Jan 02 2015 10:38:49 GMT+0000 (GMT),
end: Fri Jan 02 2015 10:38:50 GMT+0000 (GMT),
growth: 7620560,
reason: 'heap growth over 5 consecutive GCs (1s) - -2147483648 bytes/hr'
}
Memwatch发现了内存泄漏。Memwatch定义泄漏事件是:
当你的heap使用率连续5次垃圾回收后增加表示有一个泄漏事件。
内存泄漏分析
我们需要得到heap的使用率,以及memwatch自己的heap使用偏值,比如如下dump出一个heap:
var hd;
memwatch.on('leak', function(info) {
console.error(info);
if (!hd) {
hd = new memwatch.HeapDiff();
} else {
var diff = hd.end();
console.error(util.inspect(diff, true, null));
hd = null;
}
});
这段代码将给出更多heap信息:
{ before: {
nodes: 244023,
time: Fri Jan 02 2015 12:13:11 GMT+0000 (GMT),
size_bytes: 22095800,
size: '21.07 mb' },
after: {
nodes: 280028,
time: Fri Jan 02 2015 12:13:13 GMT+0000 (GMT),
size_bytes: 24689216,
size: '23.55 mb' },
change: {
size_bytes: 2593416,
size: '2.47 mb',
freed_nodes: 388,
allocated_nodes: 36393,
details:
[ { size_bytes: 0,
'+': 0,
what: '(Relocatable)',
'-': 1,
size: '0 bytes' },
{ size_bytes: 0,
'+': 1,
what: 'Arguments',
'-': 1,
size: '0 bytes' },
{ size_bytes: 2856,
'+': 223,
what: 'Array',
'-': 201,
size: '2.79 kb' },
{ size_bytes: 2590272,
'+': 35987,
what: 'Closure',
'-': 11,
size: '2.47 mb' },
...
在泄漏事件之间,看到heap以2.47M大小增加,而罪魁祸首是这里的'Closure',注意到如果你的泄漏是一个特定的类,那么what也许是你的类名,这里有足够信息让你知道泄漏发生哪里了。
虽然我们知道了泄漏发生在Closure,这对于当前案例是适用的,但没有普遍意义上的帮助。
Heapdump
node-heapdump是一个能够用于导出V8 heap 的工具,然后在Chrome Devtools中进行详细检测,你也能在其中比较heap快照,这就更容易发现你的泄漏在什么地方。
现在让我们在上面代码中导出堆图,每次有内存泄漏发生时,我们就将V8的stack输出快照到磁盘中:
memwatch.on('leak', function(info) {
console.error(info);
var file = '/tmp/myapp-' + process.pid + '-' + Date.now() + '.heapsnapshot';
heapdump.writeSnapshot(file, function(err){
if (err) console.error(err);
else console.error('Wrote snapshot: ' + file);
});
});
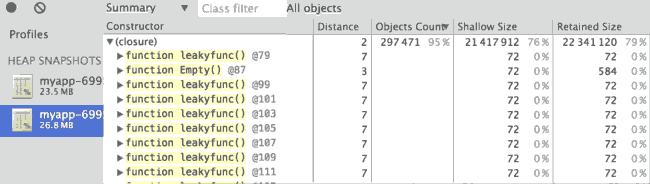
重新运行测试,你应该看到文件 '.heapsnapshot'在/tmp目录下,现在到chrome,加载DevTools点击profiles,点击 Load加载我们的快照文件。
你会看到我们的leakyfunc()是真正罪魁祸首: